Copyright © 2006 Ron Catterall
| Revision History | |
|---|---|
| Revision 0.1 | 25 February 2006 |
|
Document generated on Monday, 27 February, 2006 @ 07:16:50 |
|
These are little more than notes and some calculations about the problem of population growth in the early phases of the settlement at Monte Albán.
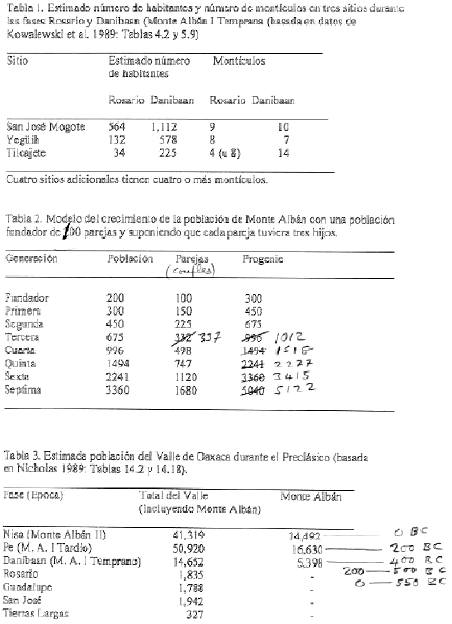
So far as we know, the mountain top that we know as Monte Albán was unpopulated prior to about 500 BC, at which time a group of people arrived and founded a new settlement on the mountain. The size of the band of arrivals is unknown, but is very unlikely to have been greater than the total population of San José Mogote at the end of the Rosario period (about 600 BC); 564 from Table 1. The population of the Monte Albán settlement grew very rapidly, and Table 3 gives figures of 5,398 in the Danibaan period (about 400 BC) and 16,630 in the Pe period (about 200 BC). Table 2 proposes a model for population growth which attempts to explain the growth of population entirely in terms of an internal expansion, assuming that each couple of each generation produced 3 surviving children. In this paper we show that this model cannot account for the increase in population between 500 and 400 BC, and that it is necessary to invoke massive and continuous immigration to the mountain top to explain the population estimates.
-
population estimates (from Table 3 provided by Marcus Winter)
Date Population The population at 500 BC is arbitrarily set at 200.
The population at 550 BC is set at 0.
The middle of the Danibaan (early Monte Albán I) is set at 400 BC.
The middle of the Pe (late Monte Albán I) is set at 200 BC.
550 BC 0 500 BC 200 400 BC 5398 200 BC 16630 0 BC/AD 14492 -
The first occupation of Monte Albán was around 500 BC, and it seems unlikely that the initial population could be greater than 500. Table 2 suggests 200 as the initial (foundation) population.
-
The model of Table 2 predicts a population of 5040 at the 7th. generation after the foundation. (There is a minor arithmetical error in Table 2, this should be 5122.) There is uncertainty here in the length of a generation period, but 3 generations per century is usually an acceptable estimate.
-
The model of Table 2 is very simple and predicts a continuing exponential growth of population - at the 10th. generation the predicted population is 17,287 - after 15 generations (about 500 years, 0BC/AD) the predicted population is 1,312,712,578. Obviously it is unreasonable to extrapolate a model outside some arbitrary limit, perhaps 7 or 8 generations in this case.
-
Apart from the simplicity of the model, the growth rate is somewhat higher (3 children per couple) than that observed generally in the world today (2.784 on average.)
-
In order to compare the model in Table 2 with the estimates of population in Table 3, it is necessary to assume a value for the span of a generation. This value can be adjusted to get a best fit to the population estimates. In order to arrive at a population of 5,400 in 4000 BC the generation span would need to be about 12 years (i.e. by the age of 12 years all parents would have produced 3 surviving children.) The model also implicitly assumes that male and female populations are equal, that all members of the population produce offspring and that there are no deaths before the end of the reproductive period.
-
A Better Approach. We can avoid making the assumptions implicit in the model in Table 2 and replace them by an assumption that birth- and death-rates in the early stages of Monte Albán were generally close to those observed in the world today. These vary quite widely from country to country, but world-wide averages should be reasonably acceptable. We take the latest published figures for birth-rates for 228 countries and death-rates for 225 countries. These are expressed in numbers per 1000 population per year, and the net growth rate is given by the difference between births and deaths. There is no hidden assumption about generations spans, equality of sex populations or survival to breed in this approach, and we can track the growth of population on a yearly basis.
-
We have no reason to believe that birth and death rates in early Monte Albán were significantly different than those found world-wide today.
-
If anything we might expect death rates to be somewhat higher in earlier times.
-
For 225 countries world-wide, the average birth rate is 17.31 births per 1,000 population per year.
-
Similarly, or 228 countries world-wide the average death rate is 7.35 per 1,000 population per year
-
The net population growth is the difference between the birth and death rates, 9.96 per 1,000 per year. This is probably the minimum assumption we can make for population growth in early Monte Albán.
-
The range of birth rates is 49.54 (Niger) to 8.02 (Bulgaria.) This is quite a wide range and obviously reflects the difference between countries, the lowest in the most industrialized areas.
-
The range of death rates is 23.84 (Malawi) to 2.31 (Kuwait,) also a wide range.
-
Generally there is a strong correlation between birth- and death- rates: high birth rates are usually accompanied by high death rates - e.g Niger, birth 49.54, death 22.78
-
Applying the world average birth- and death-rate figures takes account of all possibilities for children dieing before producing off-spring, the figures simply relate to births and deaths, no matter how or when they occur. The average number of progeny per couple will of course be higher if death in infancy and youth is significant, but assuming that all births result in additional off-spring, the effective number of children per couple is 2.784 and the birth-death rate model reduces to the model of Table 2 for a generation span of 33 years (see Figure C for the comparison.) This illustrates an obvious problem with the model of Table 2 - some children will not produce off-spring.
-
The growth of population over time is a 'compound interest' problem where the population 'Pn' after 'n' years from an initial population 'Pi' with a net growth rate 'R' = birth rate - death rate, and is given by:
Pn = Pi(1 + R)n
Note that this gives us the population increase on a yearly basis, there is no need to speculate about the length of a generation span.
-
R = 0.00996 from the difference between average birth and death rates (from 9.96 per 1000 per year.)
-
-
We can tabulate some predicted populations, Pn, for different values of the initial (foundation) population, Pi, and for different lengths of time, n, where n=100 corresponds to 400BC (middle of the Danibaan period) and n=300 corresponds to 200BC (middle of the Pe period).
Pi n Pn Pn values are calculated from Pn = Pi(1 + R)n 200 100 539 200 300 3,911 300 100 808 300 300 5,866 400 100 1,078 400 300 7,821 500 100 1,347 500 300 9,777 600 100 1,616 600 300 11,733 700 100 1,886 700 300 13,688 800 100 2,155 800 300 15,644 900 100 2,425 900 300 17,599 1000 100 2,684 1000 300 19,555 2000 100 5,388 2000 300 39,109 -
Observations.
-
There are several ways to achieve a population of around 5,400 by 400BC. For example: 1. An initial foundation population (Pi) about 2,000 and the world average growth (R) of 0.00996; 2. Pi=500 and R=1.0241; 3. Pi=200 and R=1.0335.
-
The second possibility above is rather close to the present situation in Niger, R=0.02676. Query: is modern Niger a good model for Monte Albán 2,500 years ago? The modern environment in Niger is very different to that in early Monte Albán, and the total population of Niger is a lot higher than that of early Monte Albán. The political structure is also very different. We are very hesitant about using Niger as a model for Monte Albán, the situation in Niger is one where the population is almost effectively limited by resources, whereas the small population at Monte Albá is expanding with little or no constraint. (Niger is on the top of the Weibull curve, but early Monte Albá is on the lower regions - see discussion below about the Weibull growth curve.)
-
If population kept growing at this rate (R=0.00996 and Pi=200,) the population at 0 BC/AD would have been 28,387, or with Pi=500, 70,967 (instead of 15,000)
-
Putting the foundation population anywhere in the region 200-500, there would have to have been considerable and probably continuous immigration into Monte Albán to achieve a population of around 5,400 by mid Danibaan (400BC). For an initial foundation group of 400, immigrants would then account for 4 times the population of descendants of the foundation group. (Unless we accept the parallel with Niger.)
-
The estimates in Table 3 suggest that the population had stabilized at about 15,500 over the period 200BC - 0BC/AD (in fact the estimates show some decline in population). Possibly either the ruling elite decided that no more immigration to the mountain was welcome, or that resources on the mountain were beginning to limit the resident population.
-
-
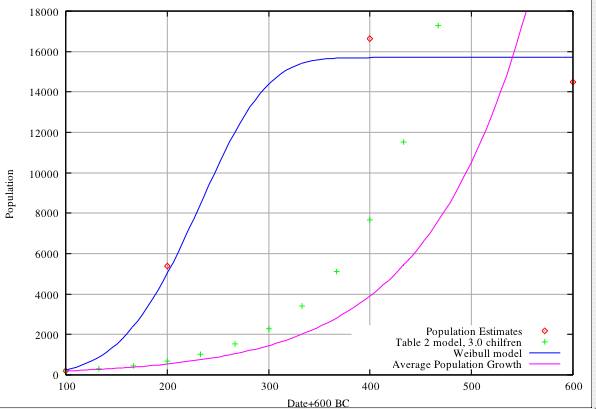
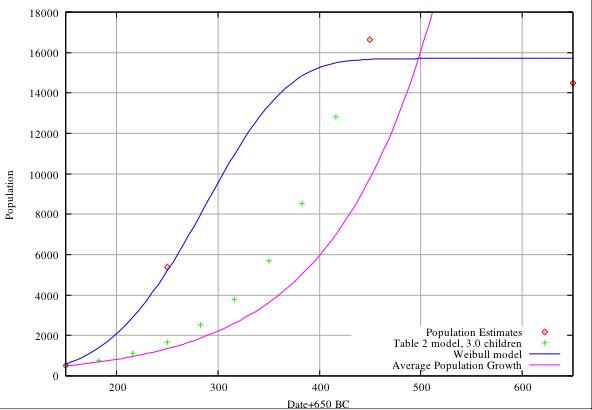
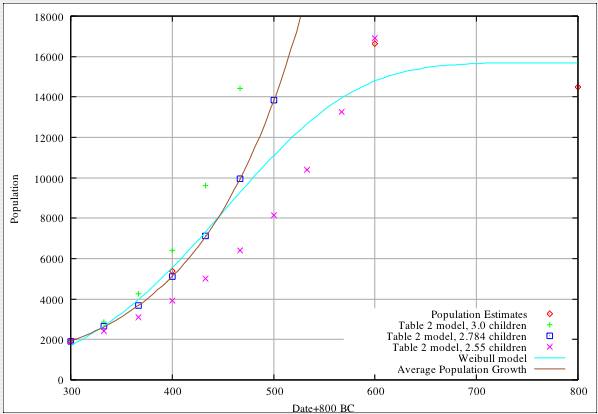
Table 2 Model Analysis. In Figure A we compare the estimates of population in Table 3 with the predictions of the model of Table 2 assuming an initial foundation population of 200 and a generation span of 33 years (3 to a century). It is clear that the model is totally unable to match the population estimates, predicting populations of 675 in 400 BC compared with the estimate of 5,398, and 7,683 compared with 16,630 at 200 BC. In Figure B we show the same comparison for an initial foundation population of 500 (about the maximum we can realistically envisage). Again the model fails, predicting 1,687 and 19,210 at 400 and 200 BC respectively. The rate of population growth predicted by the model of Table 2 is somewhat greater than that predicted by the average world-wide population growth figures. In Figure C we show the result of constraining the model of Table 2 to get approximate agreement (about 4,000 and 17,000 at 400 and 200 BC) with Table 3. This agreement is only possible for an initial foundation population of about 1,900 and a progeny rate of 2.55 children per couple. We feel that the required initial population of 1,900 is completely unrealistic.
-
Growth Function Analysis. A major problem of the models for growth proposed in Table 2 and in the use of the world-wide population figures is that they both predict unlimited and exponential growth, whereas in all observed growth situations there are always limiting factors preventing this unrestricted growth. Population growth has attracted much study in many discplines, botany, zoology, astronomy, and many others, and in general it is always found that growth follows a sigmoidal curve, slow at first, followed by a period of rapid growth, followed by a curtailment of growth and an approach to a limit as resources fail to meet the demands of further growth. Mathematical functions have been devised to 'fit' growth data, and we can apply them to population growth at Monte Albán. The Weibull function
y = ymax(1-exp(-a(tb)))
with ymax=15,700, a=1e-11 and b=4.6, provides an excellent fit to the growth data in the range 550BC (pop. 0), 500BC (pop. 200), 400BC (pop.5,500) and correctly predicts a levelling off at about 15,700 from about 300BC to 0BC and shows that there has to be a period of extremely rapid growth from about 450BC to 300BC. The best fit Weibull functions are included in Figures A, B, and C, and agree with the population estimates of Table 3 as well as can be expected within the uncertainties of the data. This fit does not take any account of whether the growth rate is physically reasonable or meaningful, and the parameters a and b have no physical significance. The parameter ymax is the highest level of population that the environment can sustain without the introduction of new resources, and the period of very rapid growth (450-300 BC) is meaningful, and is determined solely by the best fit of the function to the data.
Conclusion. The population growth at Monte Albán cannot be understood as the internal expansion of a small band of foundation settlers. By far the dominant cause of population growth at Monte Albán must have been a continual influx of new arrivals throughout the period 500 to 300 BC, most probably coming from the valley below and making more good farmland available.
Tables 1, 2 and 3 from Marcus Winter .